2 + 2Module 1: Introduction to R and RStudio
Introduction
Now that R and RStudio are installed, we can start working with them.
Before learning how to manipulate data or create figures, it is important to understand what R is, how RStudio helps us work with R, and how we can organize our work so that it is easy to save, reproduce, and return to later.
Do not worry about memorizing everything in this module. The goal is simply to become familiar with the environment we will use throughout the course.
Session slides
You can follow the presentation used during this session here:
What is R?
In short, R is a language and environment designed for performing statistical and graphical operations.
It was developed in the early 1990s by Ross Ihaka and Robert Gentleman and was inspired by an earlier programming language called S. The idea behind S was to make interactive data analysis easier and more accessible. In other words, it helped bring statistical computing closer to people who were primarily interested in analyzing data rather than becoming programmers. The problem with S is that you had to buy it, and we all know that we’d rather spend our money on more important things, like food 🍔.
One of the most important characteristics of R is that it is free and open source. This means that anyone can use it, modify it, and develop new tools for it.
Today, R is widely used in science, statistics, data science, ecology, conservation, and many other fields. Although R began development in the early 1990s, version 1.0.0 was officially released in 2000. Today, R is maintained by the R Core Team.
Tip
R is extremely flexible, but you do not need to learn everything R can do.
Most R users gradually build a collection of tools that are useful for the type of work they do.
What is RStudio?
R and RStudio are related, but they are not the same thing.
R is the program that executes our code.
RStudio is an Integrated Development Environment, or IDE, that provides a more convenient interface for working with R.
In other words:
R does the work. RStudio helps us work with R.
RStudio makes it easier to:
- write and save code,
- organize files,
- inspect objects,
- view figures,
- access help,
- manage packages,
- and organize complete projects.
Although RStudio is not the only IDE available for working with R, it is one of the most widely used, especially in teaching, science, and data analysis. This is probably because its philosophy aligns very well with that of R. It is free software intended for use by everyone. RStudio is relatively new, having been released in 2010.
This is why we will work almost entirely from RStudio during this course.
The RStudio interface
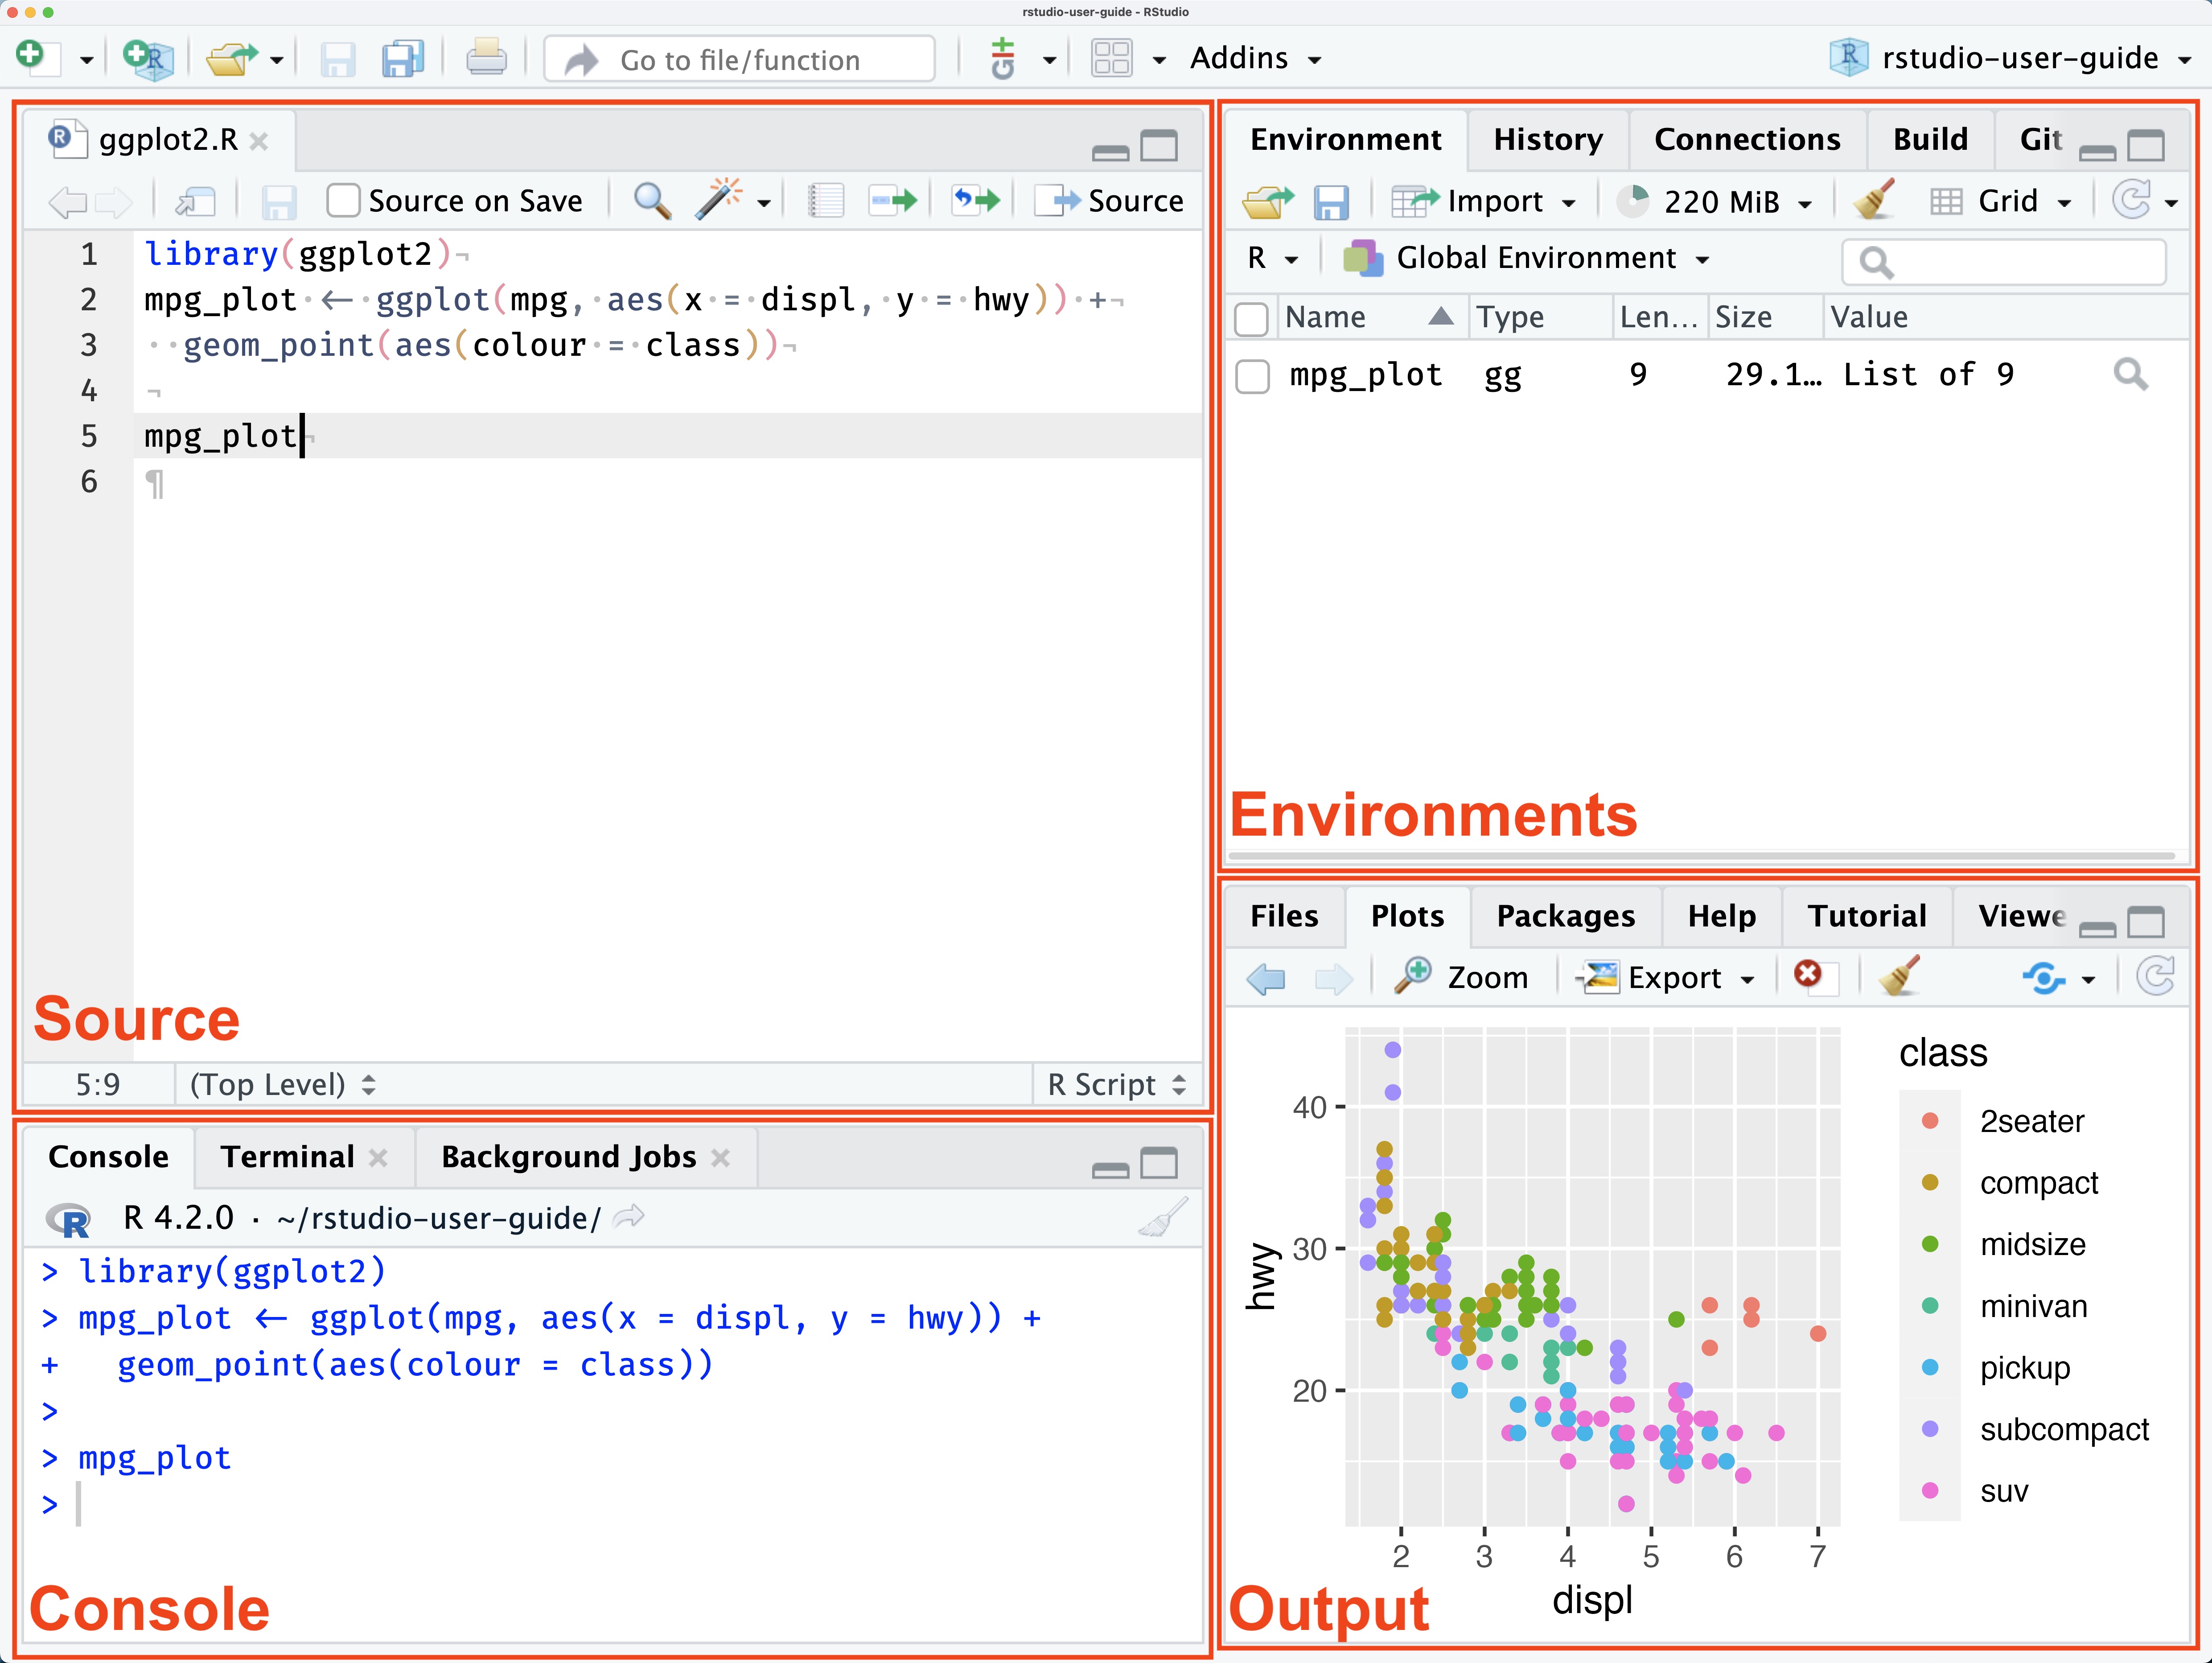
When you open RStudio, you will usually see four main panels.
The exact appearance may vary slightly depending on your version of RStudio, but the main components are the same.
Source
The Source panel is where we write and edit scripts.
This is where most of our code should live.
If you have not opened a script yet, this panel may not be visible.
Console
The Console is where R executes commands.
You can type directly into the Console and press Enter to run a command.
For example:
R returns:
[1] 4The Console is useful for quickly testing something, but it is not the best place to write an analysis because commands entered there are not automatically saved.
Environment
The Environment panel displays objects that currently exist in your R session.
We will learn what objects are in the next module.
For now, just remember that this panel helps us see the information currently stored in R.
Files, Plots, Packages, and Help
The lower-right panel contains several useful tabs.
Files allows you to navigate through files and folders.
Plots displays figures created in R.
Packages shows installed packages.
Help displays documentation for R functions and packages.
We will use all of these throughout the course.
Console or script?
One of the most important habits when learning R is to write your work in a script instead of working only in the Console.
The Console is useful for quick tests:
10 / 2But if you close RStudio, you may not remember exactly what you typed.
A script allows us to save our code and run it again later.
Let’s create one.
In RStudio, go to:
File → New File → R Script
A new blank document should appear in the Source panel.
Type:
2 + 2
5 * 4
100 / 10
Do not press Enter as you would in the Console.
Instead, place your cursor on the first line and run it using:
Windows: Ctrl + Enter
Mac: Command + Enter
You should see the command appear in the Console followed by the result.
Try running the other lines.
Write your code in scripts
Throughout this course, try to avoid writing an entire analysis directly in the Console.
Use the Console to test things, but keep the code you want to save inside a script.
Saving your script
Now save the script.
Go to:
File → Save
and give it a meaningful name.
For example:
module-01.RAvoid names like:
script1.R
new.R
test.R
Meaningful file names make projects much easier to navigate later.
We will also try to avoid spaces in file names. Instead of:
my first script.Ruse something like:
my-first-script.Ror:
my_first_script.RRStudio Projects
Among other things, RStudio supports a project-based workflow. When you start working with R, you’ll notice that you need to specify the path (folder location) where the files you’ll be using will be stored. When you start working with files in R, R needs to know where those files are located. Without a project, this often means navigating to or specifying the folder containing your data and scripts. When you create an RStudio Project, RStudio automatically uses the project folder as the working directory. There are other advantages, but this is the one most relevant to us at this level.
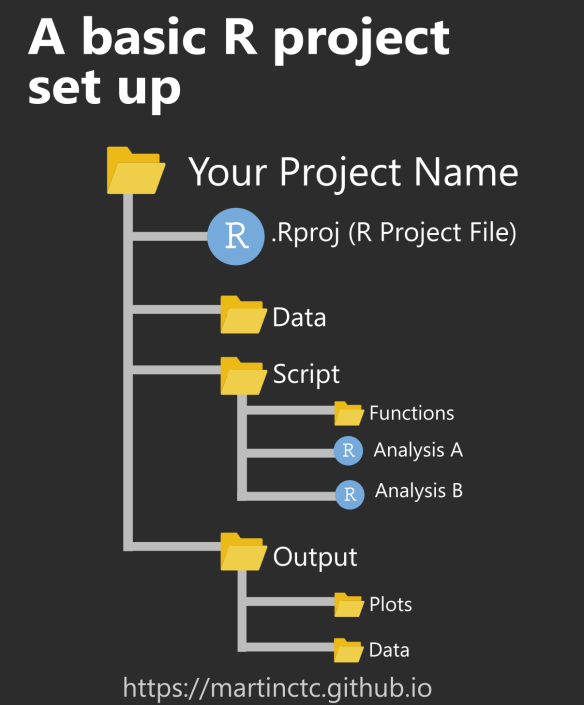
That folder can contain everything associated with a particular project:
my-project/
│
├── data/
├── scripts/
├── outputs/
└── my-project.Rproj
Using projects makes it much easier to keep your data, scripts, figures, and other files together.
It also helps R understand where your files are located.
We will use the same RStudio Project throughout this course.
Create your course project
Let’s create a new project that we can use for the rest of the course.
In RStudio, go to:
File → New Project
Then select:
New Directory → New Project
Choose a location on your computer where you can easily find the project.
Name it something like:
intro-r-courseand select Create Project.
RStudio will open a new window associated with that folder.
Inside the Files panel, you should now see a file similar to:
intro-r-course.RprojThis file identifies the folder as an RStudio Project.
Important
You normally do not need to open RStudio first and then search for your project.
You can open the .Rproj file directly, and RStudio will automatically open in the correct project.
Organizing the project
Let’s add three folders that we will use throughout the course:
intro-r-course/
│
├── data/
├── scripts/
└── outputs/
In the Files panel, select:
New Folder
and create:
dataRepeat the process for:
scriptsand:
outputsWe will use them for different purposes:
-
data/will contain our datasets. -
scripts/will contain our R scripts. -
outputs/will contain figures and other results.
Now move or save the script you created earlier inside:
scripts/Your project should look approximately like this:
intro-r-course/
│
├── data/
│
├── scripts/
│   └── module-01.R
│
├── outputs/
│
└── intro-r-course.Rproj
We will gradually add files to this project as we move through the course.
Why organize our work this way?
Imagine receiving an analysis containing files like:
final.csv
final2.csv
final_revised.csv
final_revised2.csv
script.R
script_new.R
figure1.png
and finding them scattered across Downloads, Desktop, and Documents.
It quickly becomes difficult to know which files belong together or which version was actually used.
A project gives our work a clear home.
This becomes particularly important when analyses grow larger or when we need to share our work with someone else.
Good organization is part of writing reproducible code.
Why learn R?
You might be wondering why, after years of honing your Excel skills, you now have to learn R. I can give you one “selfish” reason: in this course—and in many graduate programs—knowing R is already a requirement.
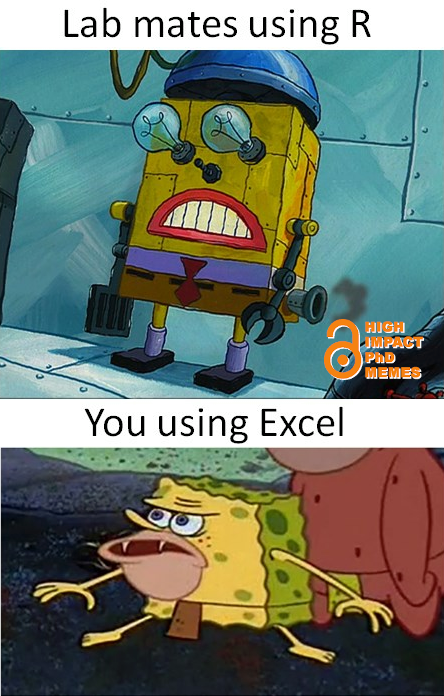
But don’t worry—R shouldn’t be a nightmare, and there are plenty of great reasons to learn it:
Reproducibility: Something very important in science, but one we might not always take into account. When you develop a script in R to analyze your research paper or thesis, you can share it. Not just so someone else can replicate it exactly and see if it’s right or wrong, but also so others can learn from it. In fact, many papers now come with their respective code.
It’s like learning a language: It exercises your brain and helps improve your quantitative reasoning. I’m not the one saying this, science does (Auker and Barthelmess 2020).
It’s the future: Whether we like it or not, programming skills are increasingly in demand and highly valued (Lai et al. 2019). Not only in academia but also in industry, knowing how to handle, visualize, and analyze data can be a huge advantage (Feng, Qiao, and Enquist 2020). I’m not saying everyone has to be an expert, but everyone should at least have a basic understanding.
(Almost) endless possibilities: These days, R isn’t just for statistics, you can do so many things with it. From documents and infographics to memes (yes, there’s even a package for making memes). Personally, I’ve learned the most about R when I combine it with my hobbies, creating graphs, exploring time-series data, music, and even politics, among other things.
What can you do with R?
Data management
Process, transform, and explore your data. A skill that will save us a lot of time and headaches. With R, you can transform your data however you want—as long as you know how. This is important because certain analyses require a specific data structure.
Stats
That’s partly why R was created. R is capable of handling a wide variety of models. But it’s the community that has taken it upon itself to add a fairly broad range of analyses to R. Today, you can find statistical models for topics such as ecology, bioinformatics, phylogenetics, molecular biology, morphometry, and more. You just have to know how to look for them.
Graphics
R’s graphics capabilities are amazing. It’s designed to generate publication-quality graphics, but you can also figure out how to create graphics for general audiences. You can make maps, animations, art, and more. Check out websites like https://r-graph-gallery.com/index.html or https://r-charts.com/ to see lots of examples and tips. Learning how to create graphics is an important part of the process of exploring your data.
Documents
With tools such as R Markdown and Quarto, you can generate HTML, PDF, and Word documents from R. Even the latest versions of RStudio include a visual mode to make writing documents easier. There are packages designed to generate resumes, presentations, books, scientific articles, and even theses.
Apps
You can also create apps and user interfaces to explore data or make life easier. For example, if you have questions about the stats of certain Pokémon, you can check out this app created in R: https://dgranjon.shinyapps.io/shinyMons/_w_74175819/
The community
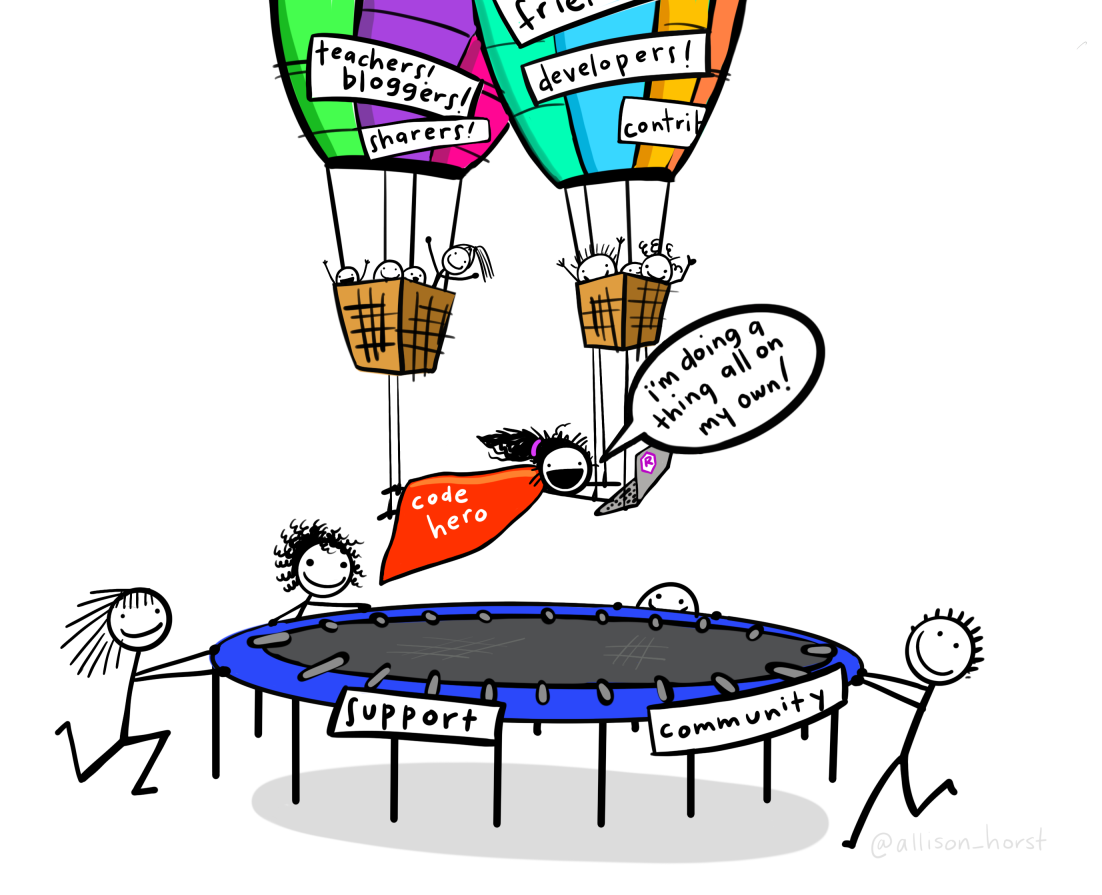
Perhaps the best thing about R and RStudio is their community. There’s a wealth of information, tutorials, guides, help pages, forums, and communities focused on helping and teaching. Best of all, it’s almost always free, in keeping with R’s philosophy.
Another very important example of how the R community organizes itself is R-Ladies.
Learning R
R, like any language, is learned through practice. That is, by writing.
Don’t expect to learn any language just by watching a movie with subtitles. Sure, you’ll pick up a word or two, but you won’t be ready to have a conversation.
The same goes for R. In this course, we’ll give you the tools to get started, but it’s normal to feel like you don’t know anything by the end (it happened to me, and I think it’ll happen to all of us).
Don’t get frustrated if you finish the course and feel like you don’t know anything, because this is just the beginning. You’ll probably go back to look up scripts on your own to remember how to create a plot or even how to load data.
You’ll also run into a lot of errors, but R isn’t about avoiding mistakes; it’s about making so many that you eventually know how to fix them.
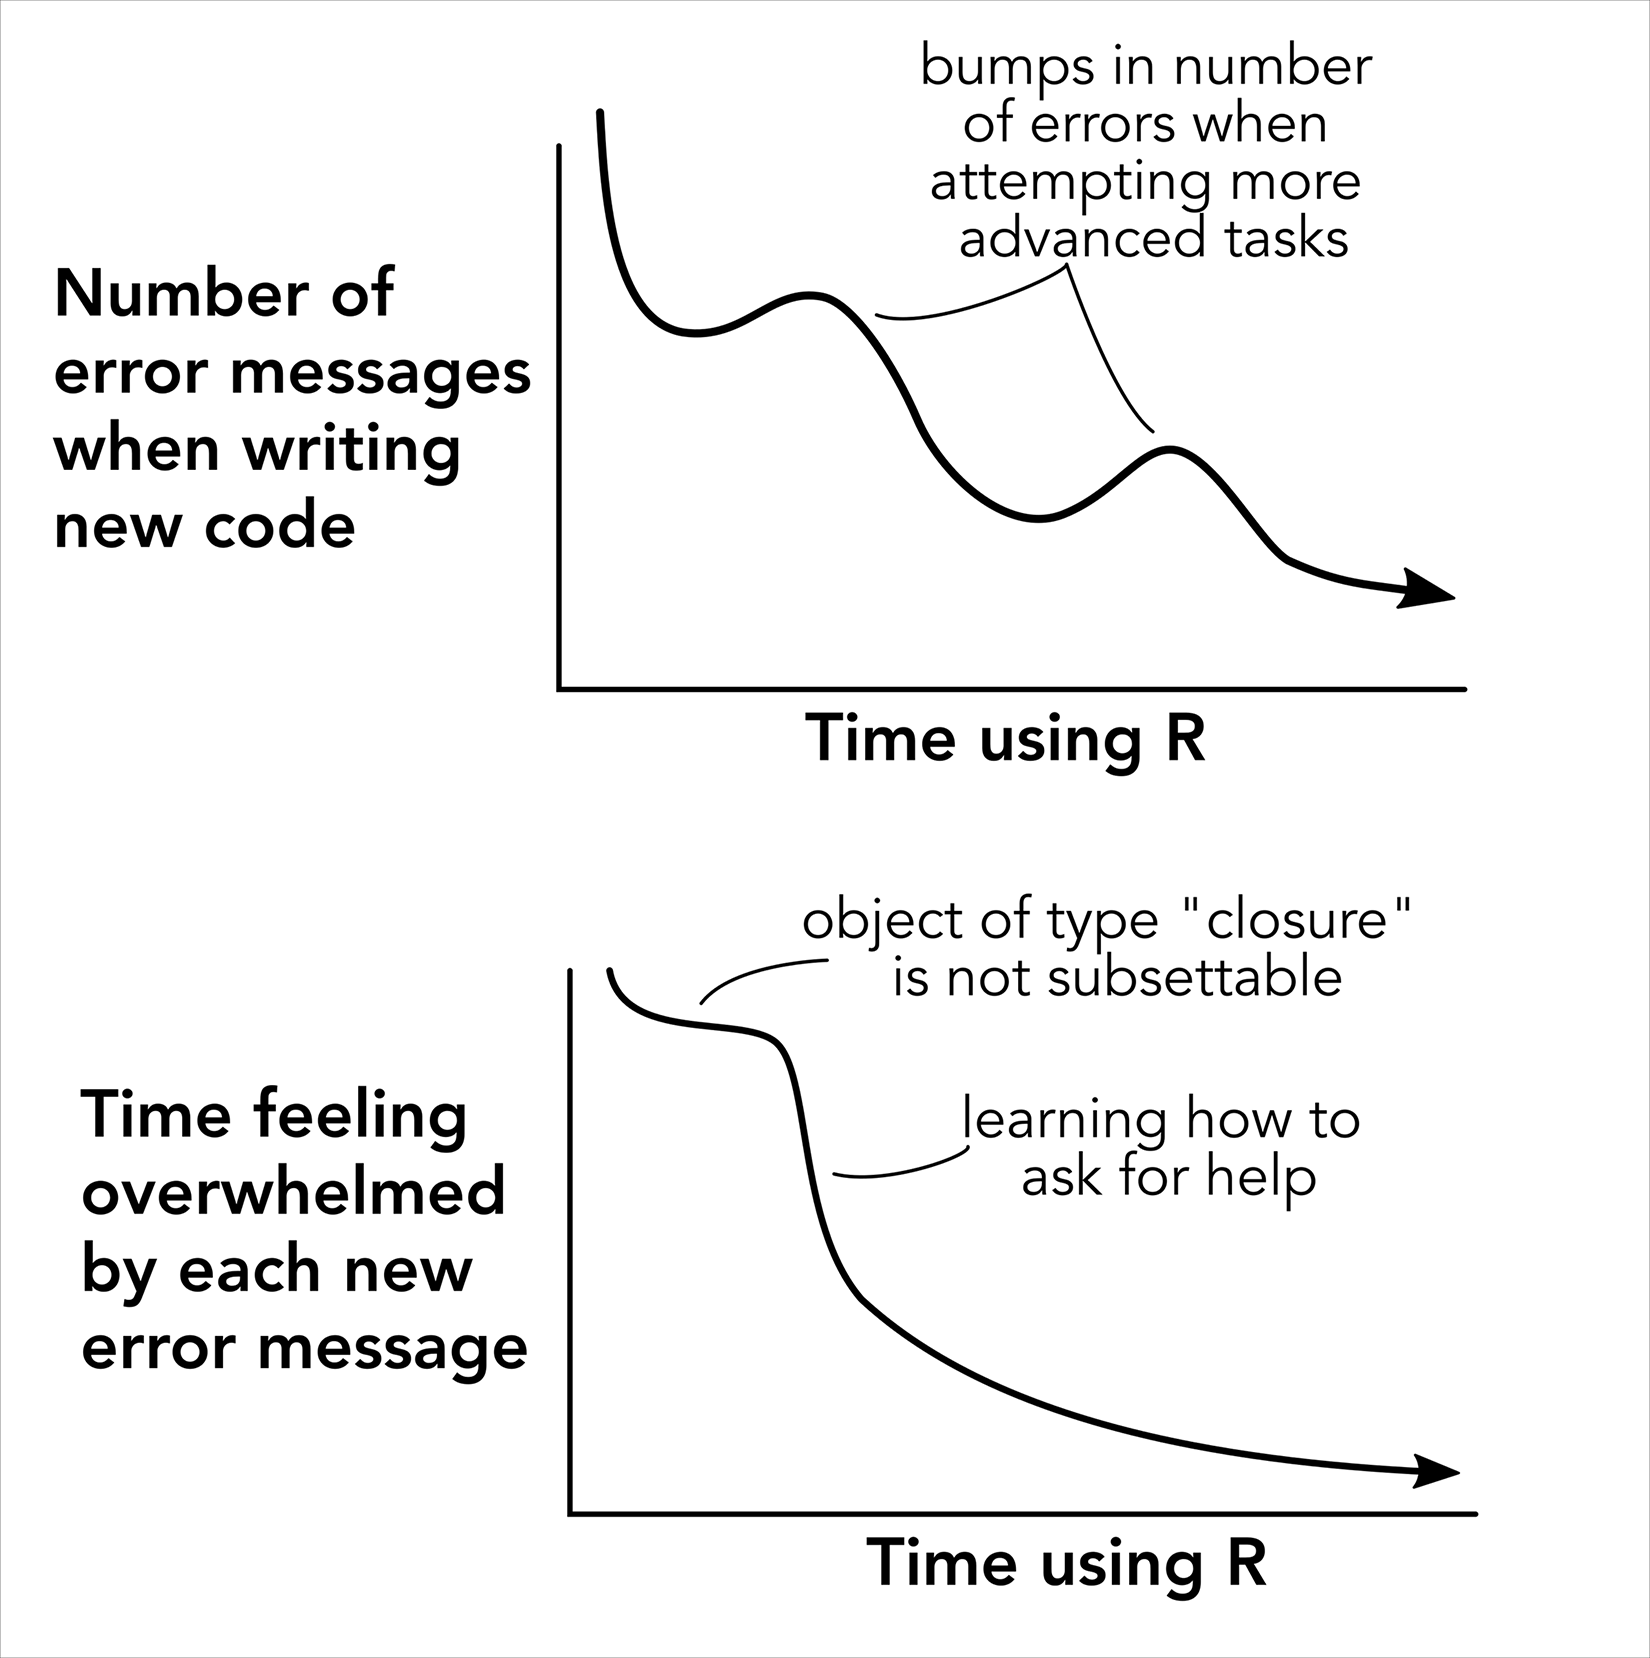
Learning R is less about memorizing commands and more about learning how to find solutions and understand what your code is doing.
Throughout this course, we will practice:
- reading error messages,
- searching R documentation,
- modifying existing examples,
- asking useful questions,
- and solving problems step by step.
We will dedicate an entire module later in the course to errors and problem solving.
You will not learn R just by reading about R
Tip
The easiest way to become comfortable with R is to use it.
You do not need to memorize every command. Write code, make mistakes, modify examples, and keep your old scripts.
You will be surprised how often you solve a new problem by looking at code you wrote before.
In summary, whether you learn R will depend on how much time you devote to it, not on whether or not you take this tutorial (Lawlor et al. 2022). So good luck and best of luck on your journey.
Practice at home
Tip
This should take approximately 10–15 minutes.
Before the next session:
- Open the
intro-r-courseRStudio Project we created today. - Create a new R script.
- Save it inside the
scriptsfolder as:
practice-01.R- Add a comment at the top describing what the script is for.
- Write and run at least three simple calculations.
- Add comments describing at least two of your calculations.
- Save the script and close RStudio.
- Open the project again using the
.Rprojfile and confirm that you can find your script.
Suggested solution
Your script could look something like this:
# Practice for Module 1

# Addition
25 + 17

# Multiplication
8 * 12

# Division
100 / 4
Your calculations do not need to be the same.
The important thing is that you can:
- open your RStudio Project,
- create and save a script,
- write comments,
- run code from the script,
- and find your work again later.
Bibliography
Auker, Linda A., and Erika L. Barthelmess. 2020. “Teaching R in the Undergraduate Ecology Classroom: Approaches, Lessons Learned, and Recommendations.” Ecosphere 11 (4): e03060. https://doi.org/10.1002/ecs2.3060.
Feng, Xiao, Huijie Qiao, and Brian J Enquist. 2020. “Doubling Demands in Programming Skills Call for Ecoinformatics Education.” Frontiers in Ecology and the Environment 18 (3): 123–24. https://doi.org/10.1002/fee.2179.
Lai, Jiangshan, Christopher J. Lortie, Robert A. Muenchen, Jian Yang, and Keping Ma. 2019. “Evaluating the Popularity of R in Ecology.” Ecosphere 10 (1): e02567. https://doi.org/10.1002/ecs2.2567.
Lawlor, Jake, Francis Banville, Norma-Rocio Forero-Muñoz, Katherine Hébert, Juan Andrés Martínez-Lanfranco, Pierre Rogy, and A. Andrew M. MacDonald. 2022. “Ten Simple Rules for Teaching Yourself R.” PLOS Computational Biology 18 (9): e1010372. https://doi.org/10.1371/journal.pcbi.1010372.
Comments
We can also add notes to our scripts using the
#symbol.Anything written after
#on a line is treated as a comment and is not executed by R.For example:
Comments are extremely useful for explaining what your code does and organizing longer scripts.
For example:
Even if your code seems obvious today, comments can make it much easier to understand when you return to it several weeks or months later.
Create a new R script and write:
Run each calculation from the script rather than typing it directly into the Console.