message("This is a message")This is a messageIf you work with R, you will get errors.
A lot of them.
That is completely normal.
Even experienced R users spend a considerable amount of time:
The difference is not that experienced users stop getting errors.
They simply become better at understanding what the error is telling them and where to look for a solution.
In this module, we will learn a simple strategy for solving problems in R.
Open your intro-r-course project and create a new R script.
Save it inside the scripts folder as:
module-06.RNot everything that appears in the R Console means the same thing.
R can give us:
Understanding the difference is the first step in figuring out what happened.
Messages simply provide information about something R is doing.
For example:
message("This is a message")This is a messageYou may also see messages when:
A message does not necessarily mean that anything went wrong.
A warning tells us that something unusual or potentially problematic happened.
However, unlike an error, the function normally continues running.
For example:
log10(-5)The calculation was attempted, but the result is not a valid real number:
NaNNaN means:
Not a Number
Warnings should not automatically be ignored.
Sometimes they are harmless, but sometimes they tell us that our result may not be what we expected.
A warning does not mean:
Everything is fine.
It means:
R completed the operation, but something happened that you should probably investigate.
Problems can also propagate through later calculations.
For example:
values <- c(2, 4, 6, NA, 10)

mean(values)
[1] NAThe function itself works correctly, but the missing value prevents R from calculating the mean.
If we know that removing missing values is appropriate, we can use:
mean(
  values,
  na.rm = TRUE
)
[1] 5.5This is why understanding your data is just as important as understanding the function.
An error stops the operation.
For example:
"1" + 2R will return an error because we are trying to add text and a number.
Another very common error is:
plot(grafics)R returns something similar to:
Error: object 'grafics' not foundR cannot find an object called grafics.
Maybe:
Error messages are information.
The first question should always be:
What is R trying to tell me?
As you begin working with R, you will probably see some errors repeatedly.
| Message | Possible problem |
|---|---|
object 'x' not found |
The object does not exist or its name is misspelled |
could not find function |
Function name is wrong or the package is not loaded |
unexpected symbol |
There may be a syntax problem |
unexpected ')' |
Parentheses may not match |
cannot open file |
File name or path may be incorrect |
non-numeric argument |
R expected numbers but received another type |
You do not need to memorize these messages.
With time, you will start recognizing them.
This sounds obvious.
But when people see a large red message in the Console, their first reaction is often:
Something is broken!
Before changing your code, read what R says.
For example:
Error: object 'grafics' not foundThe important part is:
object 'grafics' not foundNow we have something specific to investigate.
Ask yourself:
grafics?Very often, the error itself already tells us where to begin.
Many problems occur because an object is not what we think it is.
For example:
mat <- matrix(
  letters[5:20],
  nrow = 4
)

mat
[,1] [,2] [,3] [,4]
[1,] "e" "i" "m" "q"
[2,] "f" "j" "n" "r"
[3,] "g" "k" "o" "s"
[4,] "h" "l" "p" "t" What type of object is it?
class(mat)[1] "matrix" "array" What does it contain?
str(mat) chr [1:4, 1:4] "e" "f" "g" "h" "i" "j" "k" "l" "m" "n" "o" "p" "q" "r" "s" ...Now imagine trying:
mean(mat)mean() expects numeric or logical values, but our matrix contains characters.
Useful functions for investigating objects include:
class()
str()
head()
names()
dim()
summary()
We have already used most of these throughout the course.
When code fails, do not only inspect the code.
Inspect the objects being used by the code.
Many R problems are caused by very small mistakes.
Before searching for a complicated explanation, check:
recordTableis different from:
recordtablemean(valuesis missing:
)ggplot(
data = recordTable
aes(x = Species)
)is missing a comma after:
recordTableread_csv("data/camera-data.csv")will not work if the file is actually called:
camera_data.csvIf R says:
could not find function "read_csv"ask yourself whether you loaded the package:
library(tidyverse)Small mistakes are extremely common.
Check them first.
If the function exists but is not behaving as expected, check its documentation.
For example:
?meanor:
help(mean)Documentation usually contains:
For example, the help page for mean() shows the argument:
na.rmwhich allows us to specify whether missing values should be removed.
values <- c(2, 4, 6, NA, 10)

mean(
  values,
  na.rm = TRUE
)
[1] 5.5Learning how to read documentation is much more useful than trying to memorize every function.
There is a very good chance that someone else has encountered the same error before and already figured out how to fix it.
Most of the time, simply copying the error message and Googling it is enough to find a solution.

One thing I really like about R is that the community is usually very willing to help. Over time, you will also learn how to Google errors and warnings more effectively, and finding solutions will become much easier.

One very useful resource is Stack Overflow, where you can find examples and discussions about coding problems, error messages, and even statistical questions.
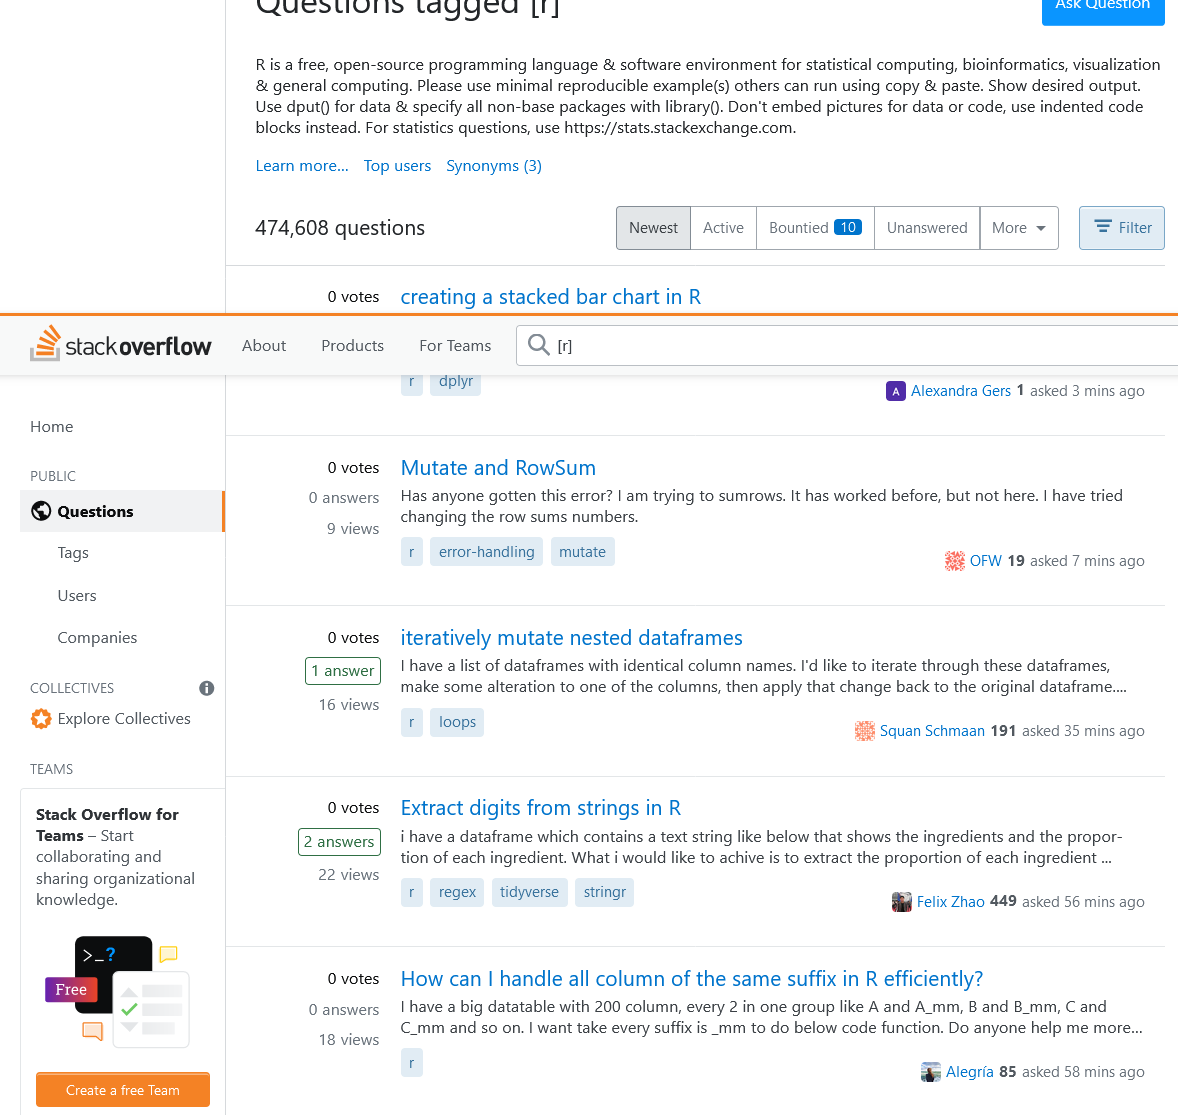
When searching, include:
Rand, when relevant, the package or function name.
For example:
R ggplot2 object not foundis much more useful than searching only:
object not foundSometimes you will still need another person to help solve the problem.
That is completely normal.
However:
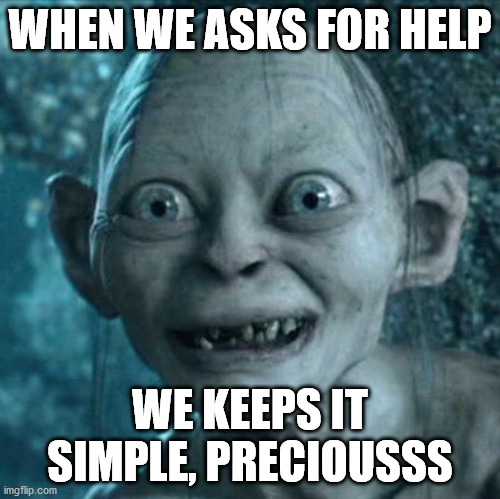
“My code doesn’t work.”
is very difficult to answer.
A much more useful question includes:
For example:
I am trying to calculate the mean number of individuals.

I ran:

mean(recordTable$N_individuals)

and received this result:

NA

I expected a numeric mean.

str(recordTable$N_individuals) shows that the variable is numeric.

What should I check next?
Now someone has enough information to help.
Nowadays, AI tools and large language models (LLMs) have become very common in coding. Whether you use them to learn, debug, or write code, they can be extremely powerful tools, but they also come with some risks.

Beyond the broader ethical discussion about using AI, these tools can influence how you learn, particularly how you learn to code.
It is really tempting to simply ask an AI to create the code for you. Sure, that can save you a lot of time, but if you are just starting to code, relying on it too much can slow down your learning.
Why?
Because programming is a lot like learning a language. You need to practice, become familiar with the syntax, make mistakes, and actually write code yourself.
If you start by simply copying and pasting everything that an AI gives you into the Console, you may get the answer, but you may not understand how you got there. And if you do not practice writing and modifying the code yourself, it will be much harder to remember how to do it later.
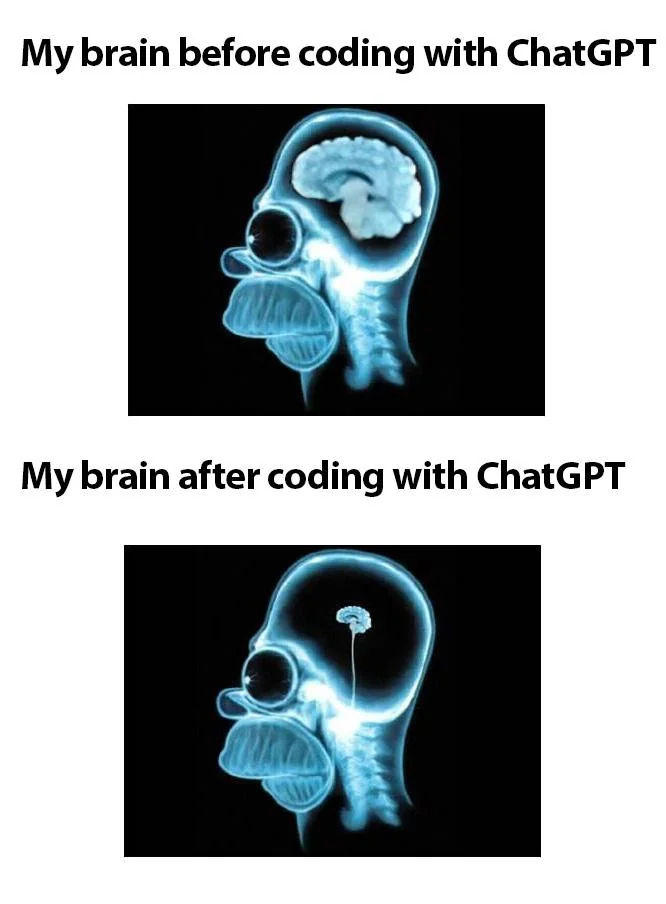
So, although this may sound a little hypocritical because I use AI a lot in my own daily work, I suggest delaying heavy reliance on AI as much as you can while you are learning the basics.
🧑💻 If you want to go further in the AI, learning, and coding topic, you can start with these readings
I say this because it is more important at the beginning to learn how R works and understand the code you are writing. Later, as you develop your programming skills, style, and experience, you can rely more on AI to assist you with repetitive tasks, debugging, brainstorming, or things you already understand.
So, if you want to use AI on a daily basis, that is completely fine. Just try to use it as a learning tool, rather than as something that blindly solves every problem or does your homework for you.
They can help you:
But the quality of the answer depends heavily on the information you provide.
My R code doesn't work. Fix it.I am using R and ggplot2.
I want to make a bar plot using the Species column from
a data frame called recordTable.
This is my code:
ggplot(recordTable, aes(x = Species))
geom_bar()
R returns:
Error: unexpected symbol
Can you explain what the error means and show me what I should check?Providing the:
goal
+
code
+
error
+
context
usually produces a much more useful answer.
An AI-generated answer should be treated as a suggestion to test, not as proof that the solution is correct.
An AI tool may:
Always:
Do not copy and run code that you do not understand.
If an AI gives you code, ask it to explain why the code works and what each important part does.
When something goes wrong, try this order:
1. Read the message
        ↓
2. Check spelling and syntax
        ↓
3. Inspect your objects
        ↓
4. Read the function documentation
        ↓
5. Simplify the problem
        ↓
6. Search for the error
        ↓
7. Ask another person or an AI tool
        ↓
8. Test and verify the solution
You will not always need every step.
With experience, you will learn which ones are most useful for different types of problems.
This activity should take approximately 10–15 minutes.
Create a new script called:
practice-06.Rinside your scripts folder.
The following pieces of code contain problems.
For each example:
number_of_cameras <- 20

Number_of_cameras + 5detections <- c(2, 5, 8, NA, 12)
mean(detections)library(tidyverse)
ggplot(
recordTable
aes(x = Species)
) +
geom_bar()camera_days <- c(
"30",
"28",
"25",
"30"
)
mean(camera_days)Imagine that R returns:
Error: object 'recordTable' not foundWrite down at least three things you would check before asking someone else for help.
R is case-sensitive.
number_of_cameras <- 20

number_of_cameras + 5The vector contains a missing value.
detections <- c(2, 5, 8, NA, 12)

mean(
  detections,
  na.rm = TRUE
)There is a missing comma after recordTable.
ggplot(
  recordTable,
  aes(x = Species)
) +
geom_bar()The values were stored as characters because they are inside quotation marks.
camera_days <- c(
  30,
  28,
  25,
  30
)

mean(camera_days)Some things you could check include:
recordTable?recordTable run successfully?recordTable appear in the Environment?Getting an error does not mean that you are bad at R.
Debugging is part of programming.
As you work with R, you will gradually move from:
I got an error 😱to:
I got an error... let's see what it says.That change is one of the most useful skills you can develop.